Our Location
Department of Irrigation & Drainage,
Jalan Sultan Salahuddin,
50626 Kuala Lumpur,Malaysia.
General line : +603- 2616 1500
Email:
pro@water.gov.my
web@water.gov.my
Get Direction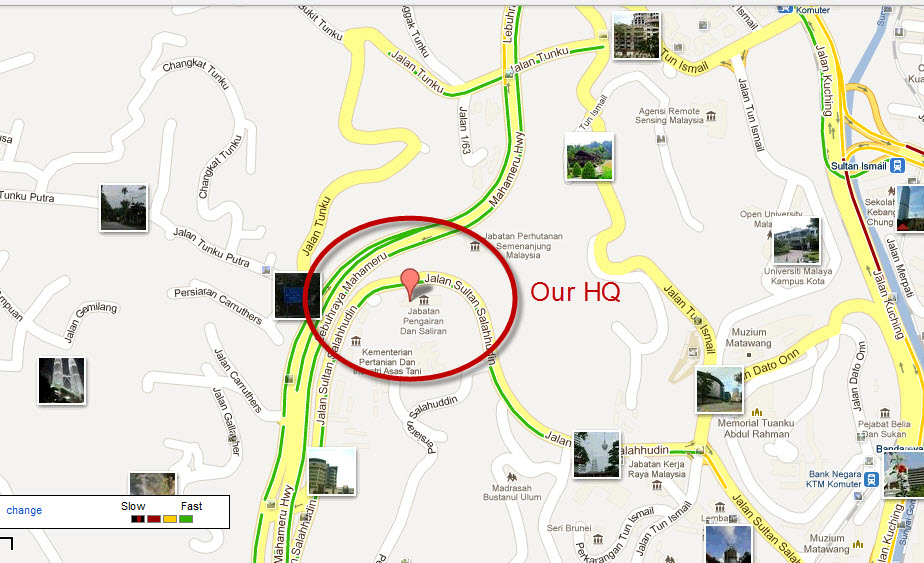
Sungai Klang originates from the Main Range of Peninsular Malaysia and runs westward towards the Straits of Melaka passing through the most developed region in Malaysia. It measures approximately 120 km long with a total catchment area of about 1,297.6 km2. Sungai Klang major tributaries include Sg. Batu and Sg. Gombak which flows through Kuala Lumpur, as well as other tributaries, namely Sg. Ampang, Sg. Jinjang, Sg. Kerayong, Sg. Kuyuh, Sg. Penchala dan Sg. Damansara. Figure 1.1 shows the location of the Sungai Klang catchment, rivers and existing dams.
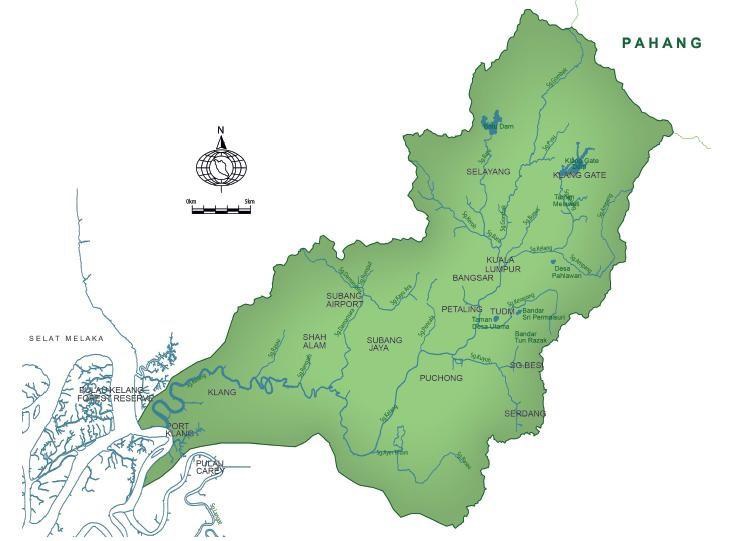
Figure 1.1 Klang River Basin
The Federal Territory of Kuala Lumpur is situated at the middle section of Sungai Klang basin while the upper and lower areas fall within Selangor state. Sungai Klang basin also covers a small area of Putrajaya, located at the South-West area. The whole study area consists of about 0.4% area of Putrajaya, 18.1% area of Kuala Lumpur and 81.5% of Selangor area. Figure 1.2 shows the boundary of the study area which includes the physical river basins boundary and the additional Tasik Subang Dam catchment area of 9.7 km2 according to the project TOR.
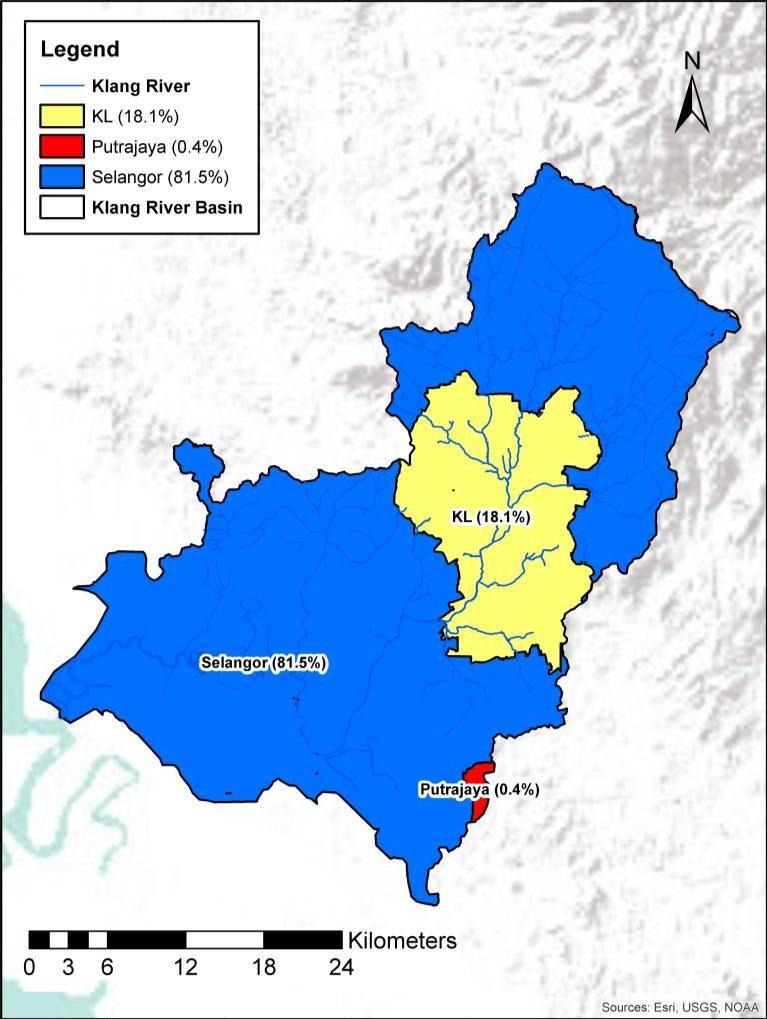
Figure 1.2 Study area
Sungai Klang basin covers the districts of Kuala Lumpur, Petaling, Klang, Gombak and Sepang (Figure 1.3 at Basin Land Use tab). The major towns and cities are Selayang, Ampang Jaya, Kuala Lumpur, Petaling Jaya, Subang Jaya, Shah Alam and Klang. The upper basin is under the jurisdiction of Majlis Perbandaran Ampang Jaya (MPAJ) and Majlis Perbandaran Selayang (MPS). While the lower basin is under the jurisdiction of four (4) main local councils of Majlis Bandaraya Petaling Jaya (MBPJ), Majlis Perbandaran Subang Jaya (MPSJ), Majlis Bandaraya Shah Alam (MBSA) and Majlis Perbandaran Klang (MPK) (Figure 1.4 at Basin Land Use tab).
Sungai Klang basin is the most developed area in the country. The basin is highly developed with urbanized land use except some pockets of green areas and the upper basin which is used as the basin water catchment.
Figure 1.3 and Figure 1.4 show Sungai Klang basin land use in year 2020 and the land use zoning in year 2035, respectively. Analysis based on projected land use changes between year 2019 and 2015 (Table 1.1) shows residential, commercial, industrial, institutional, infrastructures and transportation land use are expected to increase at 10% or more due to continued urbanization at the expense of mixed development, vacant land and water bodies.
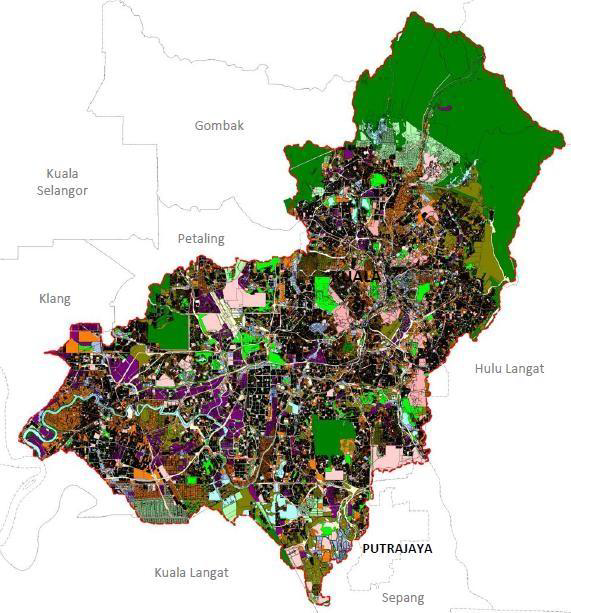
Figure 1.3 Basin land use 2019
Land Use |
Year 2019 Land Use (km2) |
Year 2025 Land Use Zoning (km2) |
% Difference |
| Residential | 251.30 | 335.57 | 33.53 |
| Commercial | 55.16 | 86.76 | 57.29 |
| Industry | 72.02 | 97.45 | 25.31 |
| Mixed Development | 0.02 | 0.01 | (-)50.00 |
| Institution and public facilities | 97.71 | 107.87 | 10.40 |
| Open space and recreation | 81.60 | 85.74 | 5.07 |
| Agriculture | 41.03 | 43.73 | 6.58 |
| Infrastructure & utility | 39.16 | 43.60 | 11.34 |
| Vacant land | 122.06 | 0.27 | (-)99.78 |
| Forestry | 261.71 | 267.76 | 2.31 |
| Water bodies | 33.81 | 28.81 | (-)14.79 |
| Transportation | 250.00 | 207.72 | 16.91 |
| Total | 1297.00 | 1297.00 |
Table 1.1 Basin land use change analysis
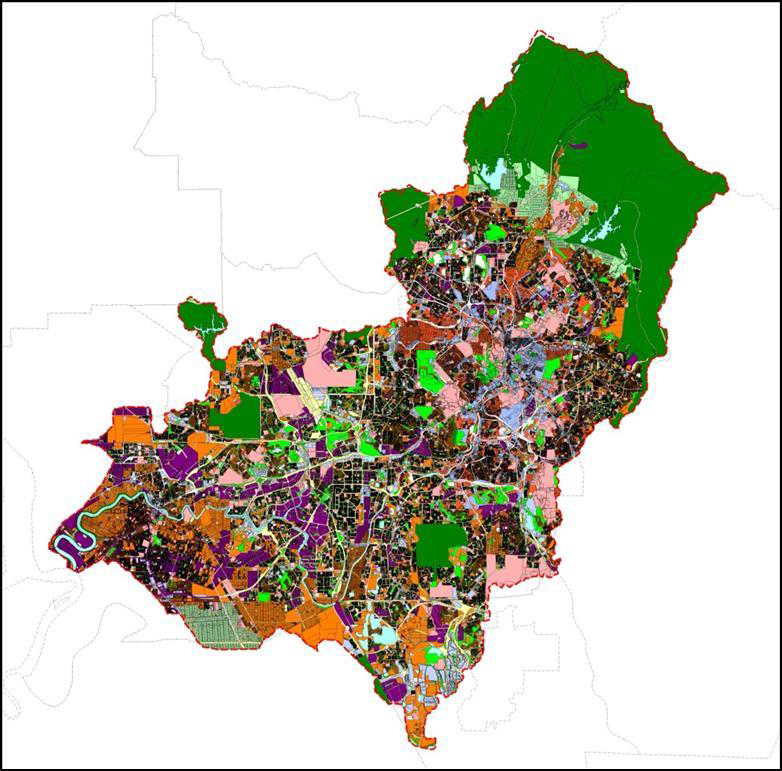
Figure 1.4 Basin land use 2025
Figure 1.5 and Figure 1.6 show the annual rainfall and average monthly rainfall within Sungai Klang basin based on the historical rainfall data from year 1980 to year 2019. The average annual rainfall is 2,457 mm. Minimum annual rainfall of 1,886 mm occurs in year 1990; while the maximum recorded annual rainfall of 3,234 mm take place in year 2000. Low rainfall occurs during the month of January to February, and June to September. The lowest monthly rainfall occurs in February 2014 at 25 mm due to the effects of the El Nino phenomenon.
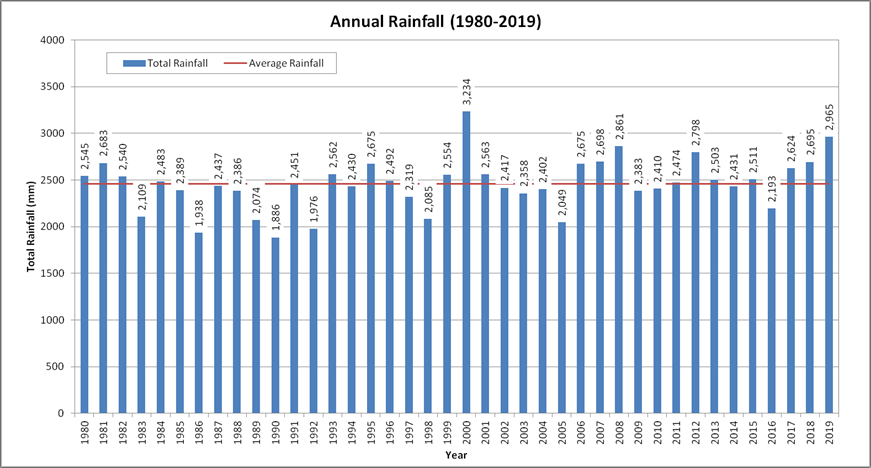
Figure 1.5 Basin annual rainfall (1980-2019)
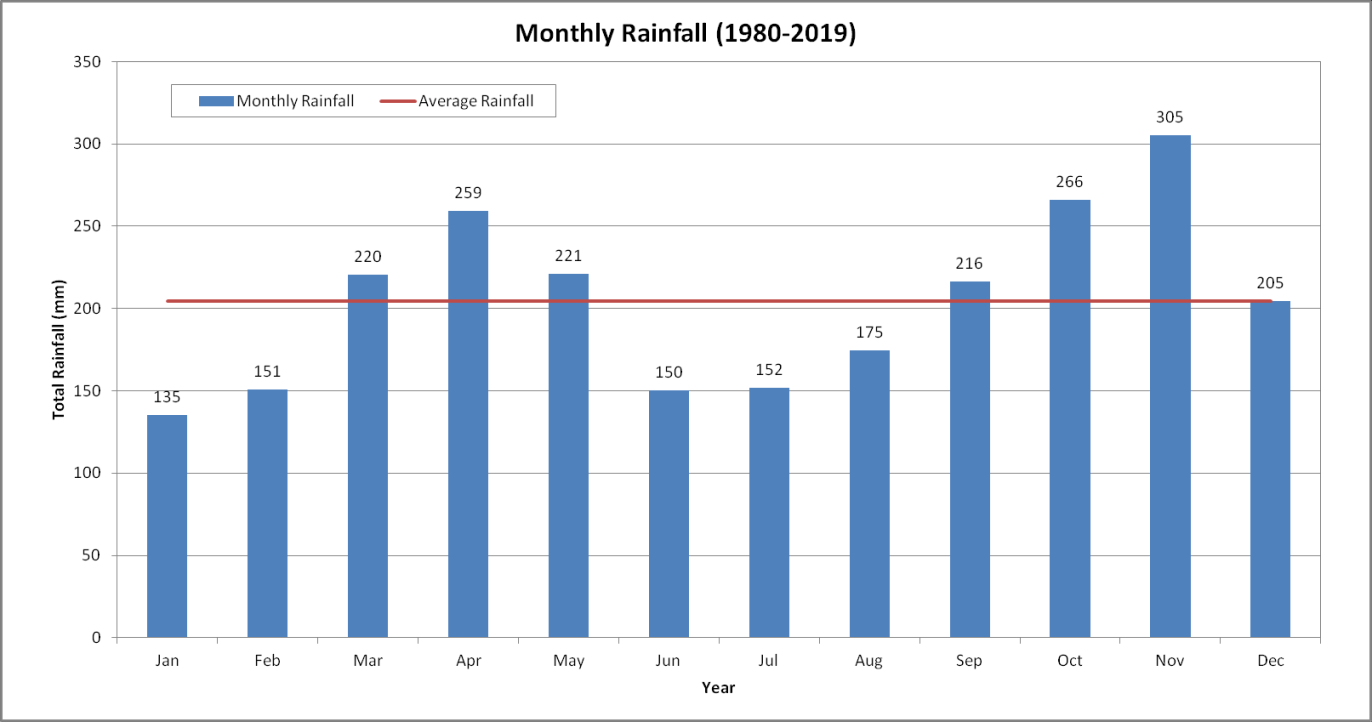
Figure 1.6 Basin average monthly rainfall (1980-2019)
Figure 1.7 shows the average monthly and annual evaporation of station 3117370 JPS Ampang at KL based on the historical data provided from year 1972 to year 2002. The average annual evaporation is 1,735 mm and the average monthly evaporation is 145 mm. Figure 1.8 shows the average monthly and annual evaporation of station 48647 Subang Airport, based on the historical data provided by MMD from year 1966 to year 2020. The average annual evaporation is 1,611 mm and the average monthly evaporation is 134 mm
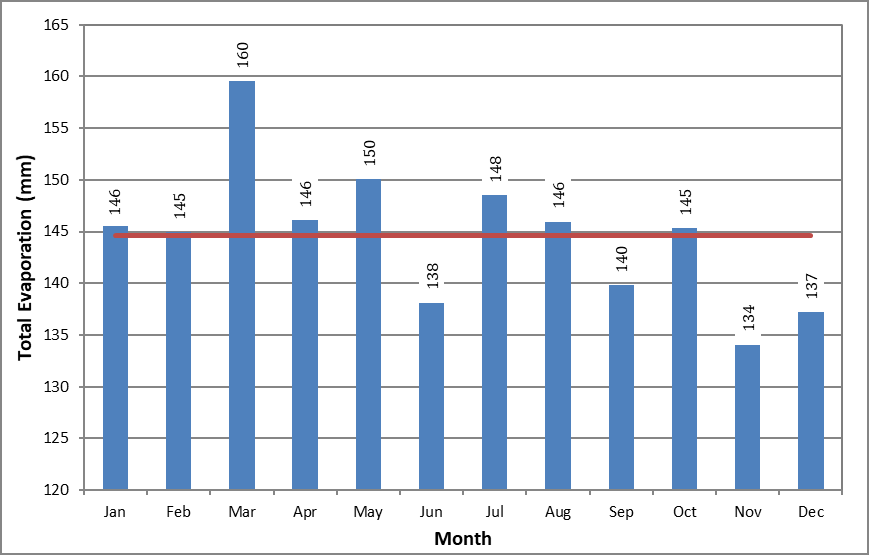
Figure 1.7 Monthly Evaporation for Station 3117370 JPS Ampang (1972 - 2002)
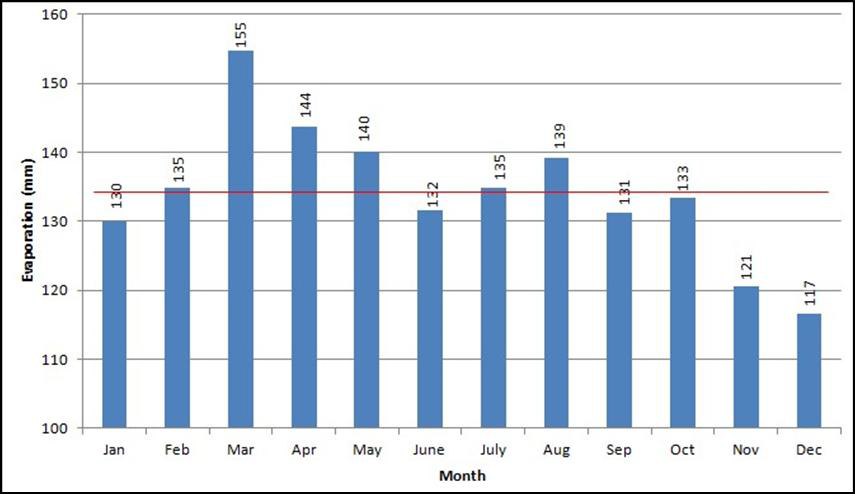
Figure 1.8 Monthly Evaporation for Station 48647 Subang Airport (1966 - 2020)
Figure 1.9 shows the distribution of river systems and dams in Sg. Klang basin. The upper which is mainly forested steep lands has two dams: Klang Gates dam and Batu dam. Both dams are used for flood mitigation and water supply purposes, primarily to Kuala Lumpur and the upper basin Selangor districts. Klang Gate dam is situated 15 km Northeast of Kuala Lumpur and Batu dam is located 16 km North of Kuala Lumpur city. Tasik Subang dam has a relatively small catchment area located in close proximity to Sg. Klang basin. It serves as direct water sources for areas surrounding the lower Klang area, including service areas outside of Sg. Klang basin. Details of the dams are summarized in Table 1.2.
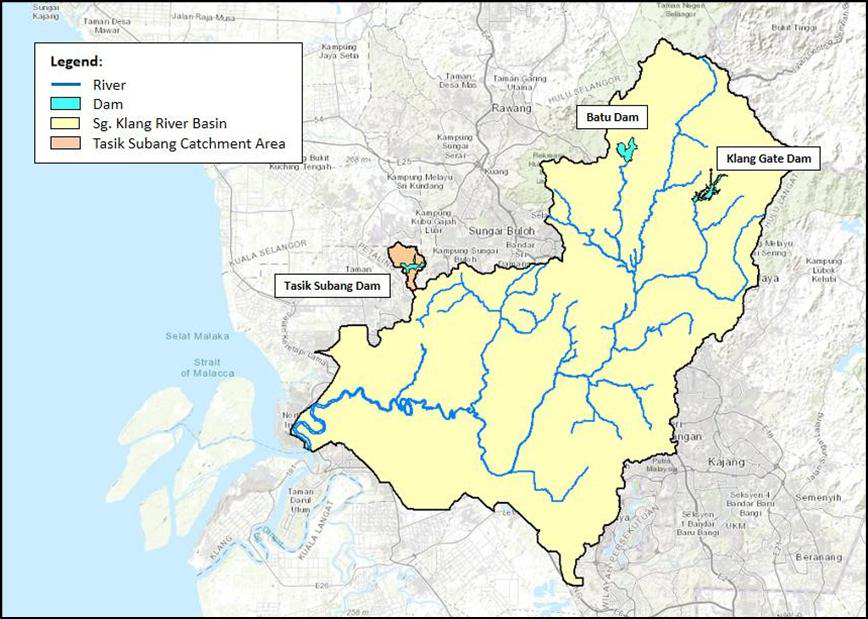
Figure 1.9 Dams and reservoirs in Sungai Klang basin
Dam |
Type |
Year of Completion |
Height(m) |
Catchment Area(sq.km) |
Gross Storage(MCM) |
Active Storage(MCM) |
| Klang Gates | Concrete | 1959 | 37.00 | 77.16 | 32.00 | 22.60 |
| Batu | Embankment | 1987 | 44.00 | 50.70 | 36.60 | 27.50 |
| Tasik Subang | Earthfill | 1950 | 9.10 | 10.16 | 3.50 | 3.45 |
Table 1.2 Summary of Dams in Sungai Klang Basin
There are eight (8) water treatment plants (WTPs) in Sg. Klang basin. Figure 1.10 shows the location of the WTPs in the study area, and the salient details are summarized in Table 1.3. Figure 1.11 shows the schematic of Sungai Klang water resources. The service areas of the eight (8) WTPs shows the water resource is unable to cater to all the basin demand (Figure 1.12).
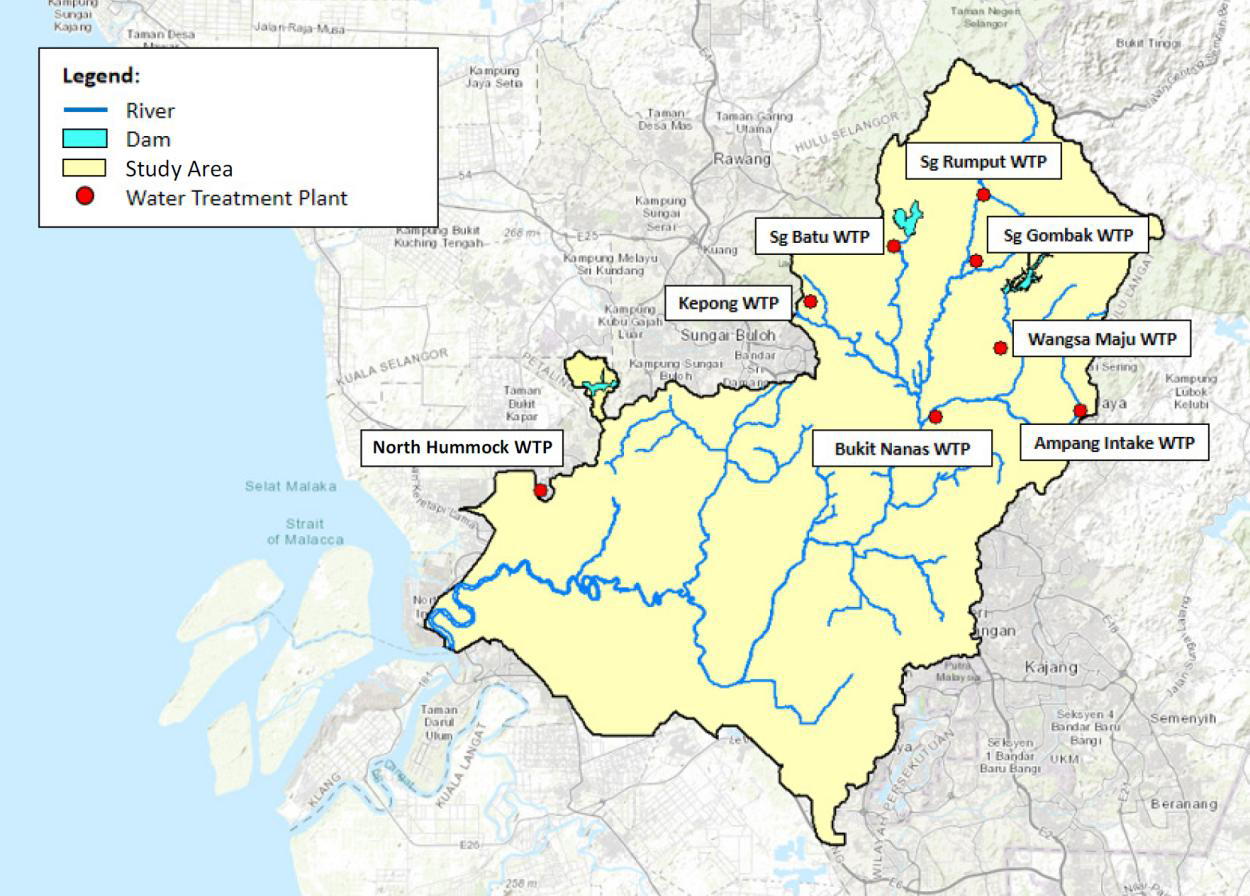
Figure 1.10 Location of existing water treatment plants in the basin
No. |
Water Treatment Plant |
Year of Commissioned |
Design Capacity(MLD) |
Source of Raw Water |
| 1. | Bukit Nanas | 1957 | 145.00 | Klang Gates Dam |
| 2. | Sg. Batu | 1980 | 113.70 | Batu Dam |
| 3. | Sg. Gombak | 1968 | 22.50 | Sg. Gombak |
| 4. | Ampang Intake | 1928 | 18.00 | Sg. Ampang |
| 5. | Wangsa Maju | 1998 | 45.00 | Klang Gates Dam & Sg. Gombak |
| 6. | Sg. Rumput | 1968 | 2.30 | Sg. Rumput |
| 7. | Kepong | 1923 | 4.50 | Sg. Kepong |
| 8. | North Hummock | 1955 | 22.50 | Tasik Subang Dam |
Table 1.3 Summary of the existing water treatment plants
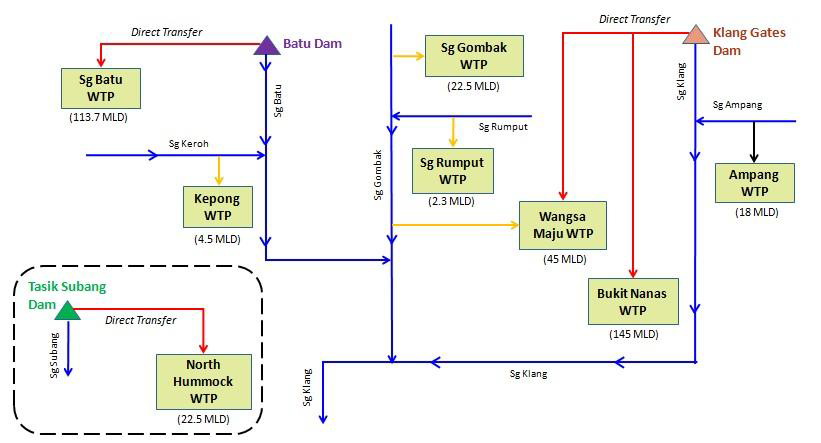
Figure 1.11 Schematic Diagram of Sungai Klang Basin Water Resources
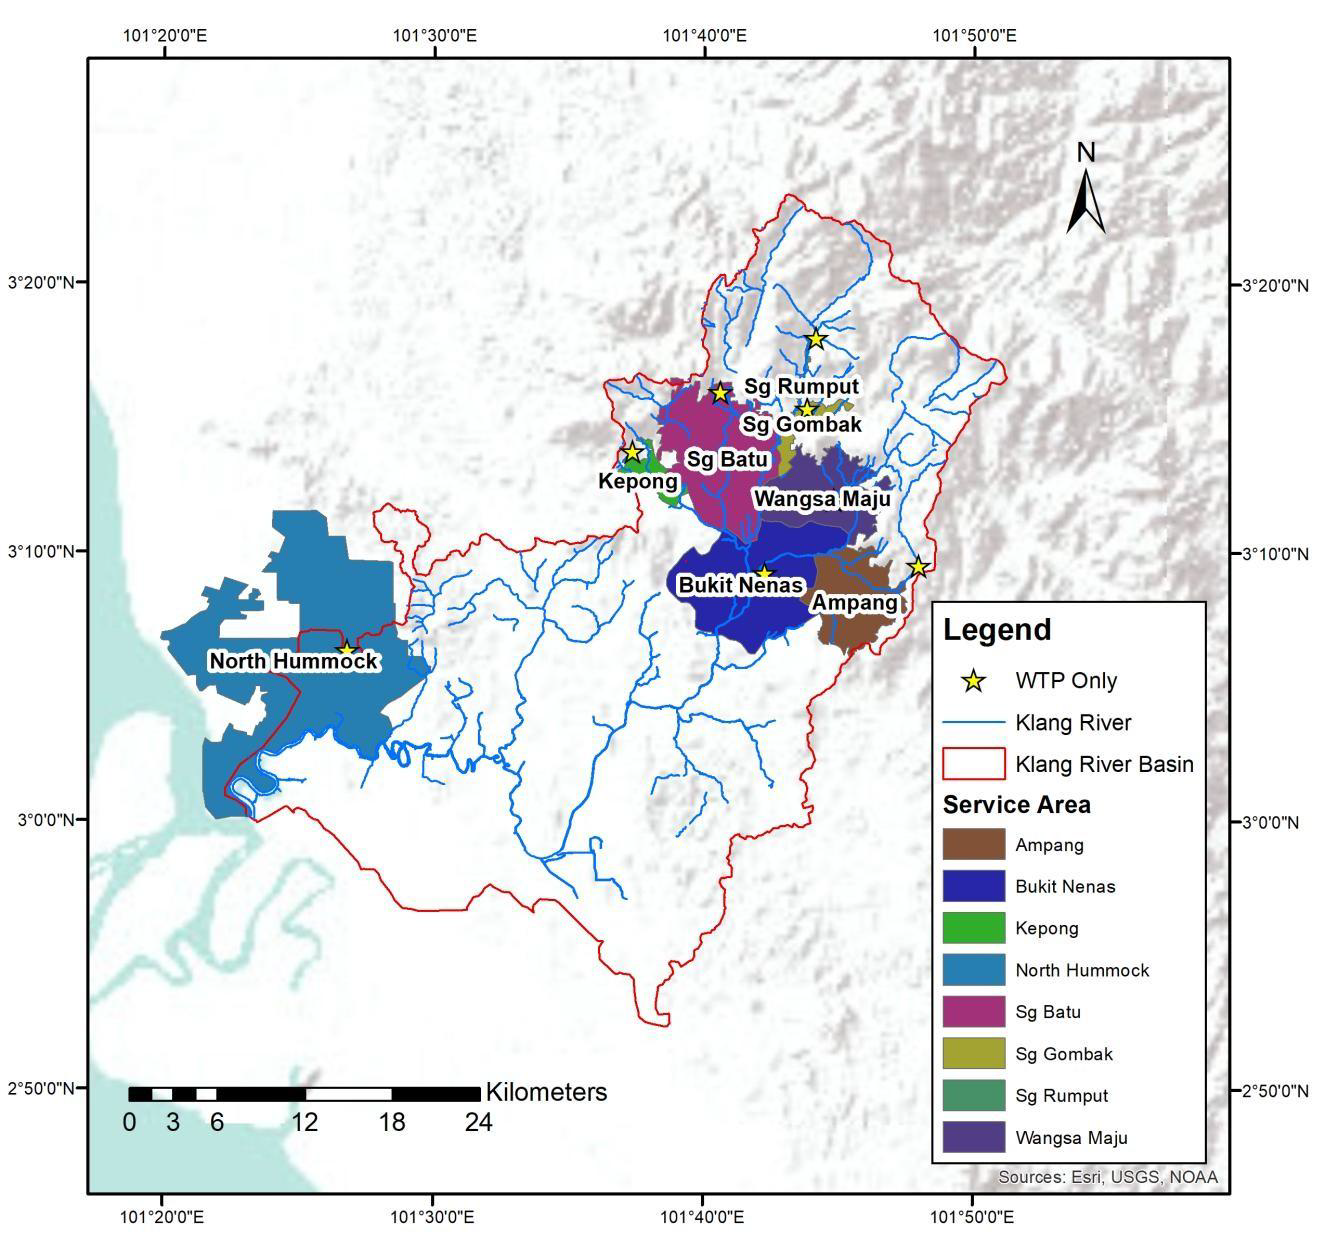
Figure 1.12 Service areas of water treatment plants in Sungai Klang basin
Malaysia had suffered series of drought events and the most recent ones are that of in year 1998, 2014 and 2016. These three (3) drought events cover almost the whole nation. There are other smaller scale episodes that only happen in smaller regions of the country. Table 2.1 summarized the recorded minimum dam water level for Klang Gates Dam, Batu Dam and Tasik Subang Dam from year 2013 to 2018. The water crisis has been a very expensive affair in many aspects.
Year |
Batu Dam |
Klang Gates Dam |
Tasik Subang Dam |
|||
| Min. Dam Level(m ODL) | Storage(%) | Min. Dam Level(m ODL) | Storage(%) | Min. Dam Level(m ODL) | Storage(%) | |
| 2013 | 101.64 | 92.90 | 92.20 | 72.90 | 36.57 | 63.06 |
| 2014 | 99.16 | 77.30 | 89.38 | 49.90 | 36.15 | 55.28 |
| 2015 | 94.35 | 51.04 | 92.00 | 71.09 | 28.02 | 94.39 |
| 2016 | 93.00 | 44.61 | 88.40 | 43.23 | 35.73 | 47.35 |
| 2017 | 94.11 | 49.86 | 90.73 | 60.20 | 37.76 | 88.62 |
| 2018 | 99.87 | 81.63 | 93.61 | 85.70 | 37.87 | 91.17 |
Table 2.1 Minimum recorded dam water level (Year 2013 to 2018)
The main water demand in Sg. Klang basin is potable water. There is no irrigation need, whereas the demand for non-paddy crop and livestock is relatively small. Fishery water demand is non-consumptive and negligible.
Potable water demand projection is derived based on the per capita consumption (PCC) and non-revenue water (NRW) selected in Table 2.2. The projection is in good agreement with published values by Air Selangor and RSN Selangor (Table 2.3).
Year |
|||||
| 2020 | 2030 | 2040 | 2050 | ||
| PCC(LCD) | High Scenario | 244.00 | 240.00 | 235.00 | 230.00 |
| Medium Scenario | 244.00 | 234.50 | 222.00 | 209.50 | |
| Low Scenario | 244.00 | 229.00 | 209.00 | 189.00 | |
| NRW(%) | High Scenario | 28.50 | 27.00 | 26.00 | 25.00 |
| Medium Scenario | 28.50 | 23.50 | 23.00 | 22.50 | |
| Low Scenario | 28.50 | 20.00 | 20.00 | 20.00 | |
Table 2.2 NRW and PCC values adopted in potable water demand projection
Notes:
1. PCC and NRW data for year 2020 is used as baseline.
2. Low scenario is based on the SPAN/ Air Selangor/ RSN target values.
Year |
2020 | 2030 | 2040 | 2050 |
| Current projection | 5775 | 6850 | 7015 | 7504 |
| Air Selangor | 5036 | 6812 | 7445 | 7517 |
| RSN Selangor | 5758 | 6885 | - | - |
Table 2.3 Potable water demand projection for Selangor and Kuala Lumpur (Including NRW)
The total potable and raw water demand are as shown in Table 2.4. The rising trend is primarily attributed to population growth, despite reduction in PCC and NRW.
Year |
2020 | 2030 | 2040 | 2050 |
| Scenario | Total Portable Demand With NRW (MLD) | |||
| High | 6285.80 | 7533.90 | 8040.80 | 8545.80 |
| Medium | 6285.80 | 7091.80 | 7478.80 | 7849.30 |
| Low | 6285.80 | 6688.30 | 6959.00 | 7196.70 |
| Scenario | Total Raw Water Demand (MLD) | |||
| High | 6616.70 | 7930.40 | 8464.00 | 8995.20 |
| Medium | 6616.70 | 7465.00 | 7872.40 | 8262.50 |
| Low | 6616.70 | 7040.40 | 7325.30 | 7575.50 |
Table 2.4 Total potable and raw water demand projection for Selangor and Kuala Lumpur
The total potable and raw water demand are as shown in Table 2.5. The minimal growth in water demand can be attributed to limited population growth in the basin and the reduction of PCC and NRW.
Year |
2020 | 2030 | 2040 | 2050 |
| Scenario | Total Portable Demand With NRW (MLD) | |||
| High | 3205.10 | 3684.90 | 3776.20 | 3859.50 |
| Medium | 3205.10 | 3466.00 | 3505.60 | 3533.70 |
| Low | 3205.10 | 3266.30 | 3255.40 | 3228.30 |
| Scenario | Total Raw Water Demand (MLD) | |||
| High | 3373.80 | 3878.80 | 3974.90 | 4062.70 |
| Medium | 3373.80 | 3648.40 | 3690.20 | 3719.70 |
| Low | 3373.80 | 3438.20 | 3426.80 | 3398.20 |
Table 2.5 Total potable and raw water demand projection for Sg. Klang basin
Figure 2.1 and Figure 2.2 show the raw water abstraction and the treated water production for each WTPs from year 2016 to year 2019. There are two (2) water sources for Wangsa Maju WTP, which includes direct transfer from Klang Gate Dam and Sg. Gombak intake. In general, the water losses of the WTPs are low.
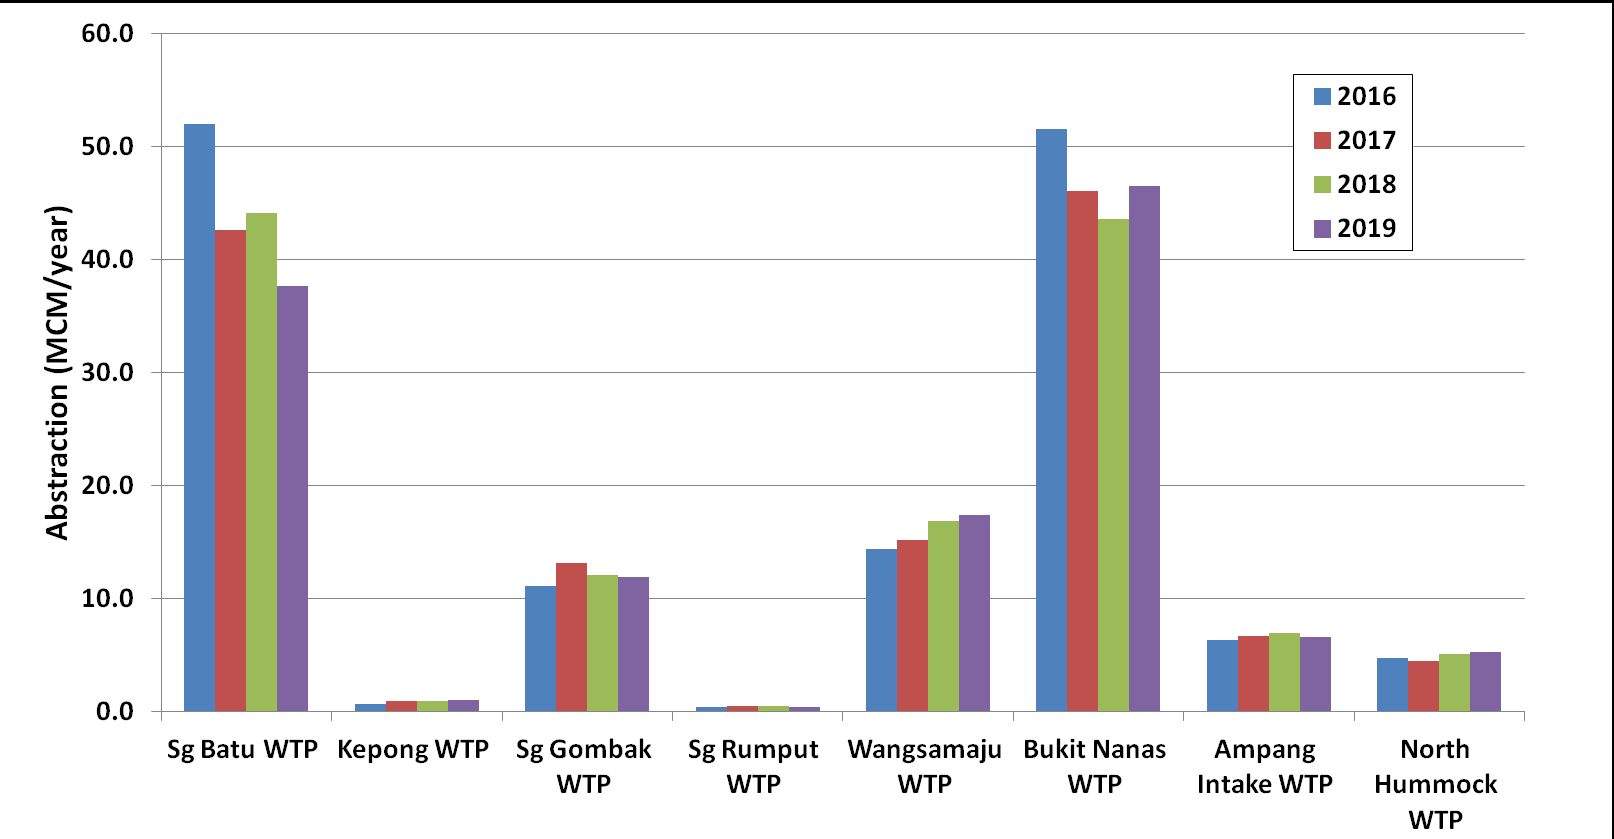
Figure 2.1 Raw water abstraction (Year 2016 - 2019)
Figure 2.2 Treated water production (Year 2016 - 2019)
Table 2.6 shows the annual water balance assessment for Sungai Klang basin based on MIKE HYDRO Basin model simulation with historical record inputs from year 2009 to 2018.
The annual average water utilization to the existing water treatment plants is 129 MCM, which includes 105 MCM (81.3%) direct supply from Batu Dam and Klang Gates Dams, and 24 MCM (18.6%) abstracted from rivers. The residual of 1448 MCM after considering the water utilization flows out to the sea as illustrated in Figure 2.10.
Table 2.7 shows the monthly water balance assessment for Sungai Klang basin from year 2009 to 2018. In comparison, during the drought year 2016, lower rainfall is observed from February to April and August to November.
| Water Balance Component | Annual Total (2009-2018) |
| A. Annual Rainfall* | 3248 |
| B. Annual Evapotranspiration* | 2126 |
| C. Dam Release & Spill* | 49 |
| D. Catchment Inflows (exclude Batu Dam, Klang Gates Dam)* | 1468 |
| E. Total Catchment Inflow* (C+D) | 1516 |
| F. Utilization: Water Supply (water source from dams)* | 106 |
| G. Utilization: Water Supply (water source from rivers)* | 23 |
| H. Total Utilization: Water Supply* (F+G) | 128 |
| I. Residual Flow (towards Klang River mouth) (E-F) | 1388 |
Table 2.6 Annual water balance assessment for Sg. Klang basin (Year 2009-2018)
| Water Balance Component | Monthly Total (2009-2018) |
| A. Annual Rainfall* | 208.69 |
| B. Annual Evapotranspiration* | 136.62 |
| C. Dam Release & Spill* | 4.05 |
| D. Catchment Inflows (exclude Batu Dam, Klang Gates Dam)* | 122.30 |
| E. Total Catchment Inflow* (C+D) | 126.35 |
| F. Utilization: Water Supply (water source from dams)* | 8.81 |
| G. Utilization: Water Supply (water source from rivers)* | 1.89 |
| H. Total Utilization: Water Supply* (F+G) | 10.70 |
| I. Residual Flow (towards Klang River mouth) (E-F) | 115.65 |
Table 2.7 Monthly water balance assessment for Sg. Klang basin (Year 2009-2018)
Note for Table 2.6 & Table 2.7:
1. *Exclude Sg. Subang, Tasik Subang Dam & North Hummock WTP.
2. Item C & Item D are based on MIKE HYDRO Basin model simulation.
3. Values in MCM.
In reality, Sg. Klang basin imports a significant amount of water from the neighboring Sg. Selangor and Sg. Langat basin. However, the actual record is not made available.
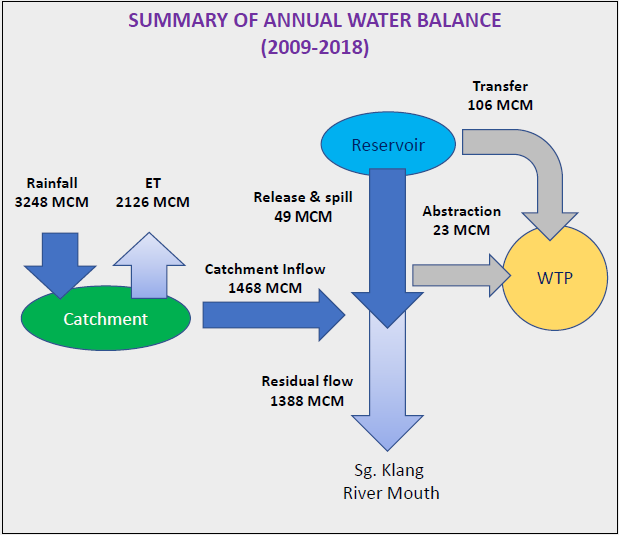
Figure 2.3 Summary of annual water balance for Sg. Klang basin (Year 2009-2018)
Four (4) key strategic actions are recommended for the Water Resource Conservation Plan (WRCP) are:
✓ Setting up urban growth boundaries
✓ Promoting infill and brownfield development
✓ Compact urban growth
✓ Increasing and enhancing public green open spaces and parks
✓ Implementation of green environmental design
✓ Implementing water sensitive urban design (WSUD) and development
✓ Establishing public awareness and outreach program
✓ Adopting and implementing the guidelines and frameworks of Environmentally Sensitive Areas (ESAs)
✓ No more forest land excision
✓ Reforesting and rehabilitating idle and vacant lands
✓ Preserving and conserving sub-catchments
✓ Protecting the riverbanks
✓ Improving and maintaining water quality
✓ Flood mitigation
✓ Inter-agency collaboration towards a holistic WRCM
Water abstractions result in the alteration and reduction of total flow in the river. This poses risks that pollutants cannot be diluted to safe levels and dispersed effectively. Severe water quality impairment can affect the ecological and hydrological functions of the river. The environmental flow is the minimum amount of water needed to balance the ecosystem services of river flow. The assimilative capacity of the river is simulated using MIKE ECO Lab based on the Total Maximum Daily Load (TMDL) approach (Figure 3.1).
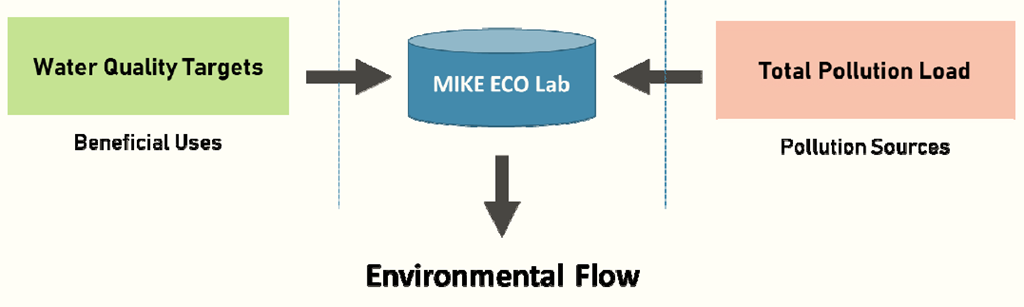
Figure 3.1 MIKE ECO Lab simulation work flow
Water quality target is assigned to each river segment based on the water quality standard and criteria for the respective beneficial use (Table 3.1) of the river water. The target setting also takes in consideration for water quality required for river rehabilitation and conservation plans.
| Class | Beneficial use |
| Class I | Conservation of natural environment |
| Water Supply I - Practically no treatment necessary | |
| Fishery I - Very sensitive aquatic species | |
| Class IIA | Water Supply II - Conventional treatment required |
| Fishery II - Sensitive aquatic species | |
| Class IIB | Recreational use with body contact |
| Class III | Water supply III - Extensive treatment required |
| Fishery III - Common, of economic value and tolerant species; livestock drinking | |
| Class IV | Irrigation |
| Class V | None of the above |
Table 3.1 Water classes and beneficial use in National Water Quality Standard

Director General of Department of Irrigation & Drainage Malaysia, Y. Bhg. Datuk Ir. Hj. Ahmad Husaini bin Sulaiman is a Chairman in MIHP "A body that represent Malaysia in all IHP UNESCO programme."

Director General of Department of Irrigation & Drainage Malaysia, Y. Bhg. Dato' Ir. Hj. Ahmad Husaini bin Sulaiman is a Deputy Chairman in South East Technical Committee "GLOBAL WATER PARTNERSHIP".
Director General of Department of Irrigation & Drainage Malaysia, Y. Bhg. Dato' Ir. Hj. Ahmad Husaini bin Sulaiman is a Committee Member of INWRDAM.

Director General of Department of Irrigation & Drainage Malaysia, Y. Bhg. Dato' Ir. Hj. Ahmad Husaini bin Sulaiman is an AFEO Honorary Member.
Director General of Department of Irrigation & Drainage Malaysia, Y. Bhg. Dato' Ir. Hj. Ahmad Husaini bin Sulaiman
is a Committee Member of MSAN.

Director General of Department of Irrigation & Drainage Malaysia, Y. Bhg. Dato' Ir. Hj. Ahmad Husaini bin Sulaiman is a Board Member of National Engineering Coordinator Malaysia.
Director General of Department of Irrigation & Drainage Malaysia, Y. Bhg. Dato' Ir. Hj. Ahmad Husaini bin Sulaiman is a Board of Director of LUAS.
No. |
Location |
Scope |
Remarks/ Valid Until |
|---|---|---|---|
|
1. |
DID Seberang Perai Utara, Kepala Batas, Pulau Piang |
Operation and Maintenance Servicing of Sungai Muda Irrigation Scheme, Department of Irrigation and Drainage Seberang Perai Utara, Pulau Pinang. |
4 October 2010 |
|
2. |
DID Sabak Bernam |
Operation and Maintenance Servicing of Bagan Terap Pump House Irrigation Scheme, Department of Irrigation and Drainage Sabak Bernam District, Selangor. |
28 September 2012 |
|
3. |
DID Kuala Muda / Sik / Baling |
Pekula Irrigation Scheme, DID Kedah. |
29 November 2010 |
|
4. |
RTB Sungai Muda |
Operation and Maintenance of Ampang Jajar and Muda River Flood Mitigation Components. |
28 September 2012 |
Bil. |
Location |
Scope |
Remarks / Valid Until |
|---|---|---|---|
|
1. |
DID Perlis |
Management of Sungai Perlis |
28 November 2011 |
|
2. |
DID Pulau Pinang |
Management of Sungai Pinang |
20 September 2010 |
|
3. |
DID Johor |
Management of Sungai Skudai |
25 August 2011 |
|
4. |
DID WP Kuala Lumpur |
Service for Management of Sungai Penchala Wilayah Persekutuan Kuala Lumpur. |
20 July 2012 |
|
5. |
DID Melaka |
Management of Sungai Melaka |
20 September 2012 |
|
6. |
DID Pahang |
Management of Sungai Galing |
30 September 2012 |
|
7. |
DID Negeri Sembilan |
Management of Sungai Termiang |
20 September 2012 |
No. |
Location |
Scope |
Remarks/ Valid Until |
Certification |
|---|---|---|---|---|
|
1. |
Muda Irrigation Scheme (Serial No.: 040, 041) |
Provision of Developmental Services of Tersier's Irrigation And Drainage System in the MADA Area, Muda Irrigation Scheme. |
19 October 2010 |
JPS |
|
2. |
DID Johor |
Provision of Operational Services of Agriculture Drainage System, Department of Irrigation and Drainage of Johor. |
3 May 2010 |
SIRIM |
|
3. |
DID Kerian |
Quality Management in the Operational Services of Selingsing's Canal Irrigation Systems. |
5 October 2012 |
JPS |
|
4. |
DID Negeri Sembilan |
Provision of Services for Floof Mitigation Management and River and Coastal management in DID Negeri Sembilan |
19 October 2010 |
JPS |
|
5. |
DID Perak Tengah |
Quality management in the Operational Services of Seberang Perak's Irrigation Systems |
11 June 2011 |
JPS |
No. |
Location |
Scope |
Remarks/ Valid Until |
Certification |
|---|---|---|---|---|
|
1. |
DID Larut Matang/ Selama, Taiping, Perak (No. Siri: 046, 047) |
Provision of River Maintenance Services of Taiping Area, DID Larut Matang & Selama, Taiping, Perak Darul Ridzuan. |
25 Sept. 2010 |
JPS |
|
2. |
DID Melaka |
Provision of River Management/Flood Mitigation Project, Urban Drainage, Coastal and Agriculture Drainage Services in DID Melaka |
26 October 2010 |
Moody International |
No. |
Location |
Scope |
Remarks/ Valid Until |
Certification |
|---|---|---|---|---|
|
1. |
Mechanical and Electrical Service Division, DID Terengganu (Serial No.: 037) |
Provision of Services for Developmental and Maintenance of Mechanical and Electrical Equipments |
1 December 2011 |
JPS |
|
2. |
Mechanical and Electrical Service Division, Rambah, DID Johor (Serial No.:044,045) |
Provision of services to the Workshop of Mechanical Service Division And Servicing Works of Locks, DID Johor |
22 March 2010 |
JPS |
No. |
Location |
Scope |
Remarks/ Valid Until |
Certification |
|---|---|---|---|---|
|
1. |
DID State of Pahang |
Land Development Application Processing Service in Department of Irrigation and Drainage State of Pahang Darul Makmur |
17 October 2011 |
JPS |
No. |
Location |
Scope |
Remarks/ Valid Until |
Certification |
|---|---|---|---|---|
|
1. |
IADA Kerian-Sg. Manik |
Construction Project/ Contract managemant |
30 October 2012 |
JPS |
|
2. |
North West Selangor Agriculture Development Project (KETARA) (Series No. : 031) |
Construction Project/ Contract managemant |
5 October 2012 |
JPS |
|
3. |
UPPP Kelantan (Serial No.: 036) |
Construction Project/ Contract managemant |
5 October 2012 |
JPS |
|
4. |
DID Kelantan |
Construction Project/ Contract managemant |
17 October 2011 |
JPS |
No. |
Location |
Scope |
Remarks/ Valid Until |
Certification |
|---|---|---|---|---|
|
1. |
Hydrological Equipments Unit, Hydrology and Water Resources Division, DID Malaysia. |
Acquisition, Installation, Maintenance And Repair of Equipments for the Purpose of Data Collections for the Research and Development of Hydrology And Water Resources, Flood And Drought Monitoring Countrywide. |
18 October 2011 |
SIRIM |
|
2. |
Hydrology and Water Resource Division, DID Malaysia. |
Provision of Management Services of Hydrological Data DID Malaysia (DID Malaysia Headquarters and 12 State DID Office In Peninsular Malaysia). |
24 October 2010 |
SIRIM |
No. |
Location |
Scope |
Remarks/ Valid Until |
Certification |
|---|---|---|---|---|
|
1. |
Training and Career Development Division |
Scheduled Course Management |
19 October 2010 |
JPS |
|
2. |
Humid Tropic Centre Kuala Lumpur |
Provision of Research Services for Hydrology and Water Resources. |
18 Sept. 2012 |
SIRIM |
Bil. |
Implementing Office |
Scope of Certification |
Note/Expire By |
Certification Body |
|---|---|---|---|---|
|
1. |
DID Kelantan |
Occupation Safety and Health Management Related to Mechanical and Electrical Operation Works and Maintenance, Supervision of Construction Works and Management of Hydrological Data at JPS Kelantan |
18 October 2010 |
SIRIM |
|
2. |
DID Wilayah Persekutuan/RTB Lembah Sg. Klang |
Provision of Supervision for Management of Hydrological Data and supervision of Construction Works |
25 March 2010 |
SIRIM |
|
3. |
DID Pulau Pinang |
Mainteinance Works And Operations of Pump and Pump House at JPS Pulau Pinang |
22 October 2011 |
SIRIM |
|
4. |
DID Pahang |
Occupation Safety and Health Management Related to Mechanical and Electrical Operation Works and Maintanance, Supervision of Construction Works and Management of Hydrological Data at JPS Pahang |
13 March 2011 |
DID |
|
5. |
Mechanical And Electrical Division, DID Johor, Batu Pahat |
Services in Mechanical Services Division's Workshop and Maintenance Works of Control Gates by JPS Johor |
3 September 2010 |
DID |
|
6. |
Beris Water Resource Development Program |
Maintanance and Operation Works of Beris Dam |
17 October 2011 |
DID |
|
7. |
DID Terengganu |
Occupation Safety and Health Management Related to Mechanical and Electrical Operation Works and Maintenance, Supervision of Construction Works and Management of Hydrological Data at JPS Terengganu |
5 October 2012 |
DID |
|
8. |
Sg. Muda Flood Mitigation Program |
Occupation Safety and Health Management Related to Operation Works And Maintenance of RTB Sungai Muda Pakej 1 dan 2A Hulu Projects |
5 October 2012 |
DID |
|
9. |
Mechanical And Electrical Division, DID Kedah |
Occupation Safety and Health Management Related to Operation Works and Maintenance in the Workshop, Onto Pump Houses and Control Gates by JPS Kedah |
5 October 2012 |
DID |
Bil. |
Implementing Office |
Scope of Certification |
Note/Expire By |
Certification Body |
|---|---|---|---|---|
|
1. |
Mechanical And Electrical Division, Ipoh |
Provision of Mechanical and Electrical Services Related to Pumps and Control Gates to support State Irrigation and Drainage department |
14 November 2010 |
NIOSH |
JPS has received the award from 'The World Federation of Engineering Organizations and the Consolidated Contractors Company' (CCC) in Tunisia for "Small Dam and Irrigation Facilities Project" at MARDI Station, Jelebu, Negeri Sembilan.
Director General of Department of Irrigation & Drainage Malaysia has received the IEM award for his contributions to the IEM for the year 2002.
The Stormwater Management and Road Tunnel (SMART) has been awarded the "Asean Outstanding Engineering Achievement Award for year 2011" as a recognition of an outstanding engineering project which have made significant contributions to the country's development in conjunction with the 29th Conference of ASEAN Federation of Engineering Organizations (CAFEO 29) held on November 27-30, 2011 at Bandar Seri Begawan, Negara Brunei Darussalam.
The Stormwater Management and Road Tunnel (SMART) won the Road Engineering Excellence Award 2010 in conjunction with the 8th Malaysian Road Conference held on October 11, 2010 at Sunway Pyramid Convention Centre. The award was presented by the Minister of Works, Y. B. Dato' Shaziman Abu Mansor at a luncheon during the Conference's opening ceremony to the co-owner of the SMART, Department of Irrigation and Drainage and Malaysian Highway Authority. The SMART project previously received various recognitions at local and international levels. These included the Best Engineering Achievement Award 2010 (IEM), 2008 British Construction Industry Awards (BCIA), the British Engineering Construction Excellence Award 2008 (ACE), Malaysian Engineering Development Award 2008 (ACEM) and the Malaysian Construction Industry Excellence Award 2007 (CIDB).
Department of Irrigation & Drainage,
Jalan Sultan Salahuddin,
50626 Kuala Lumpur,Malaysia.
General line : +603- 2616 1500
Email:
pro@water.gov.my
web@water.gov.my
Get Direction
*Click to enlarge the image
Increased coastal erosion problems in the shores of Malaysia have threatened local human life as well as cause damages to property and land. Realising this matter, the Government conducted the Coastal Erosion Study in 1984. Results from the Study suggested two level action plan comprise of short and long term action to overcome this problem. To ensure these strategies are carried out effectively, the government have set up a Technical Coastal Engineering Center in the Department of Irrigation and Drainage since 1st Januari 1987.
The main role of the Technical Coastal Engineering Centre is to carry out case studies and also prepare detailed designs for coastal erosion works. It also provides technical advice and coastal information to the country's Coastal Erosion Council along with measures taken as a Technical Information Centre for the public and private sectors which are involved in the coastal zone developement. In 1990, the Technical Coastal Engineering Centre was placed under Coastal Engineering Division. Coastal Division and River Division was merge during DID Re-Structuring exercise in 2005 to form River and Coastal division. This new division consists of River Section and Coastal Section. Further transformation occurs in 2009 when this division is known as River Basin and Coastal Zone Management Division to reflect its real function. All coastal functions are now managed by Coastal Section.
Coastal erosion problems threaten the life, properties and economic activities along coastal zone. Therefore, coastal erosion control programme is essential to mitigate these threats in affected areas.
*Click to enlarge the image
Made rivers in Malaysia are clean, vibrant and liveable.
Lead and provide world-class services in integrated river basin management to improve quality of life and environmental sustainability.
Contributing towards the government's efforts to improve the quality of life by Program Management and Conservation River Basin Efficient, Comprehensive and Integrated.
Provide expertise services in river management in an integrated manner including policy making and legislation and to ensure river basin managed perfectly for the conservation of water resources quantity and quality ( Clean, Living & Vibrant River)
*Click to enlarge the image
*Click to enlarge the image
*Click to enlarge the image
Kuantiti air: Mengenal pasti langkah-langkah jangka panjang untuk mengurangkan risiko banjir.
Kualiti Air: Mengenal pasti langkah-langkah jangka panjang untuk mengurangkan impak pencemaran (non-point source) kepada sungai dan saliran
Aset Inventori: Menyediakan Aset Inventori untuk saliran di dalam kawasan kajian
*Click to enlarge the image
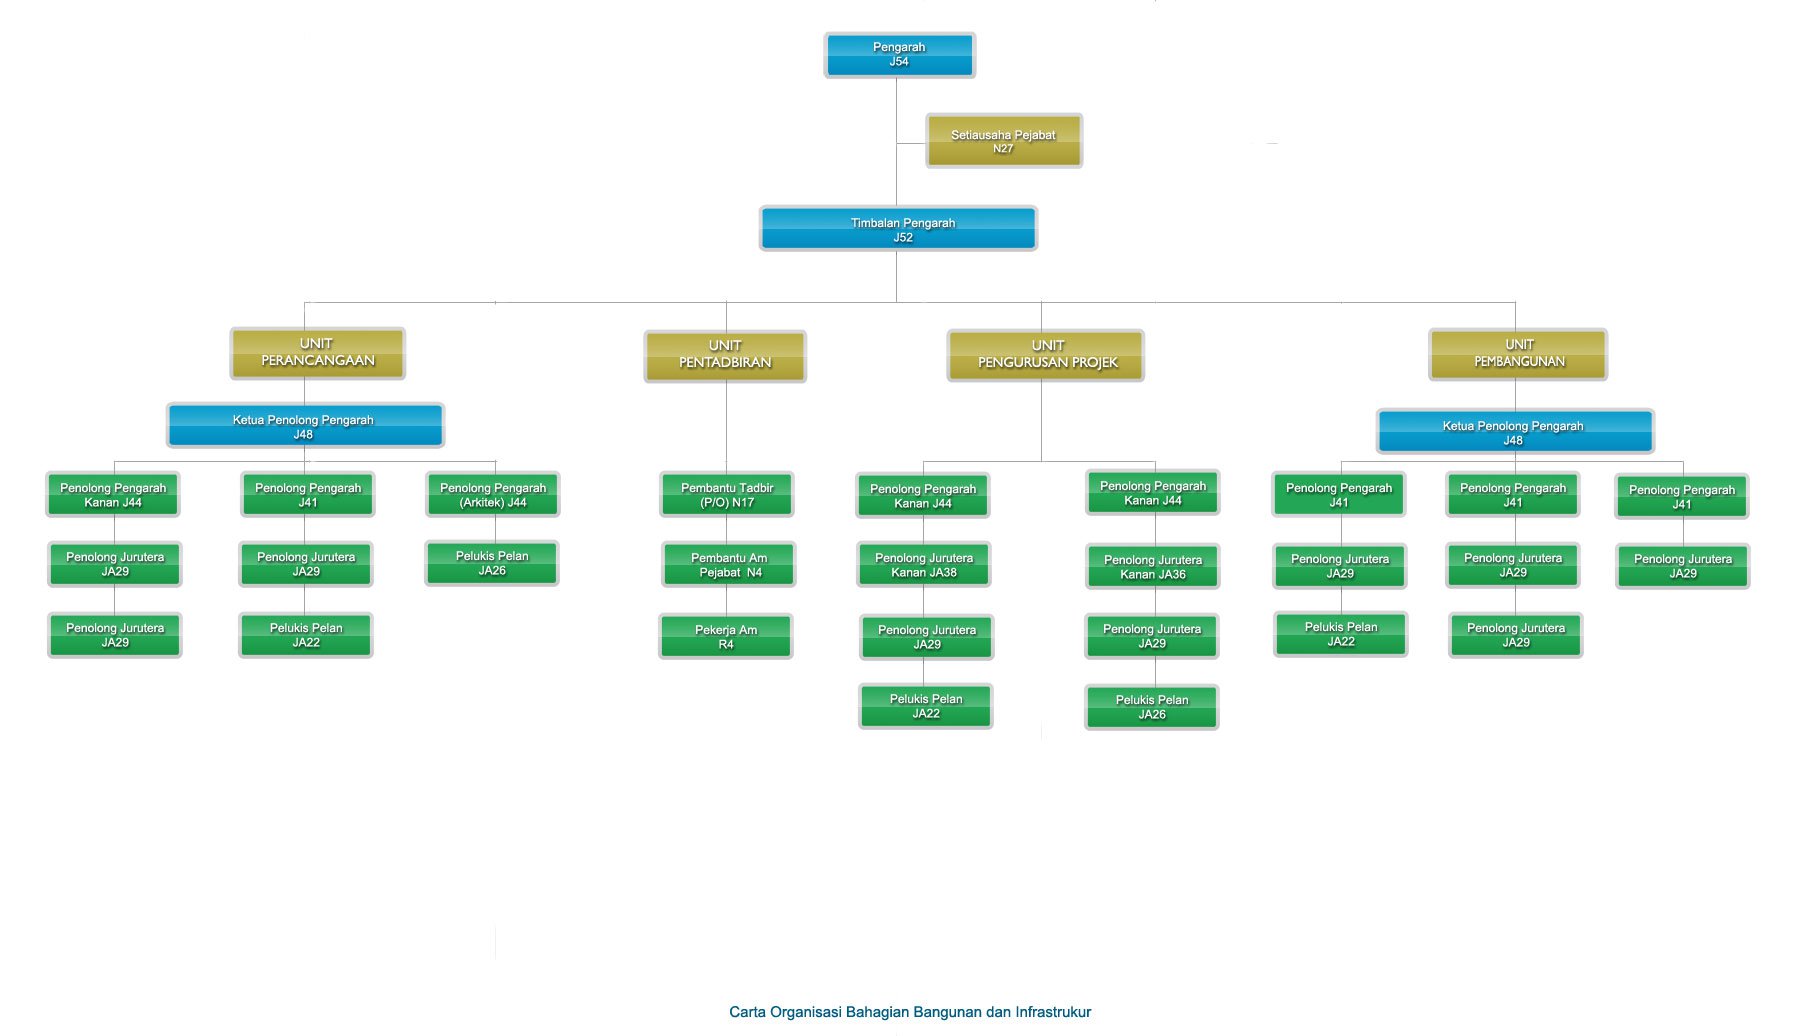
Building and Infrastructure Division (BBI) is a new Division which was upgraded from the Building Unit which resulted from the isolation of the unit from the Structure, Geotehcnical and Dam Division. It's existence came into force after being approved during the Post Cabineet Meeting of the Ministry of Natural Resources and Environment so that it's implementation becomes the sole agency responsible in implementing building and infrastructure related works for the Department as well as agencies within NRE so as not to depend on the Public Works Department for implementation.
Building and Infrastructure Division is responsible for the planning, designing and construction works for buildings projects as well as other related structures. As the implementing agent and technical consultant this Division provides technical consultation services, project management services as well as operational and maintenance management services through four (4) units as follows:-
*Click to enlarge the image
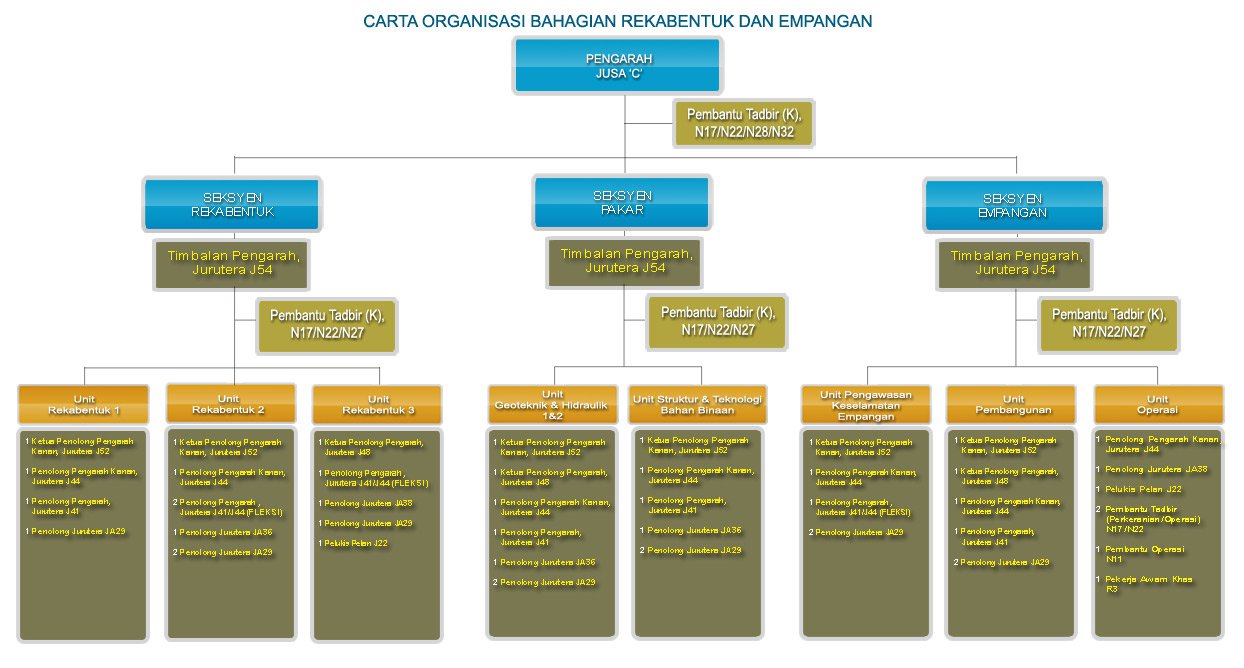
The origin of Design and Dam Division was traced back to the Design Branch. In 1993, the branch name was changed to the Structure and Geotechnical Branch. Corresponding to the restructuring of the Department, the Specialist Services Division was formed replacing the Structure and Geotechnical Branch. At the same time , the function of Specialist Services Division was further strengthened with inclusion of Dam Monitoring Unit.
At the end of 2005, concurrent with the reorganization of the DID, the division name was once again changed to the Structure, Geotechnical dan Dam Division (BSGE). In line with the restructuring of the Department on August 1, 2009, the Design and Dam Division was formed to replace the Structure, Geotechnical and Dam Division. Headed by the Director, the Division consists of three sections, namely : Design Section, Specialist Section dan Dam Sections.
*Click to enlarge the image
*Click to enlarge the image
*Click to enlarge the image
We are committed to provide quality & professional consultancy and management services in mechanical & electrical engineering to the highest level of customers satisfaction, foster good engineering practices and be environmentally-conscious.
To be the recognized body in providing comprehensive mechanical & electrical engineering services in water related management to meet high standards of quality, service and innovation towards our customers, our country and the environment.;
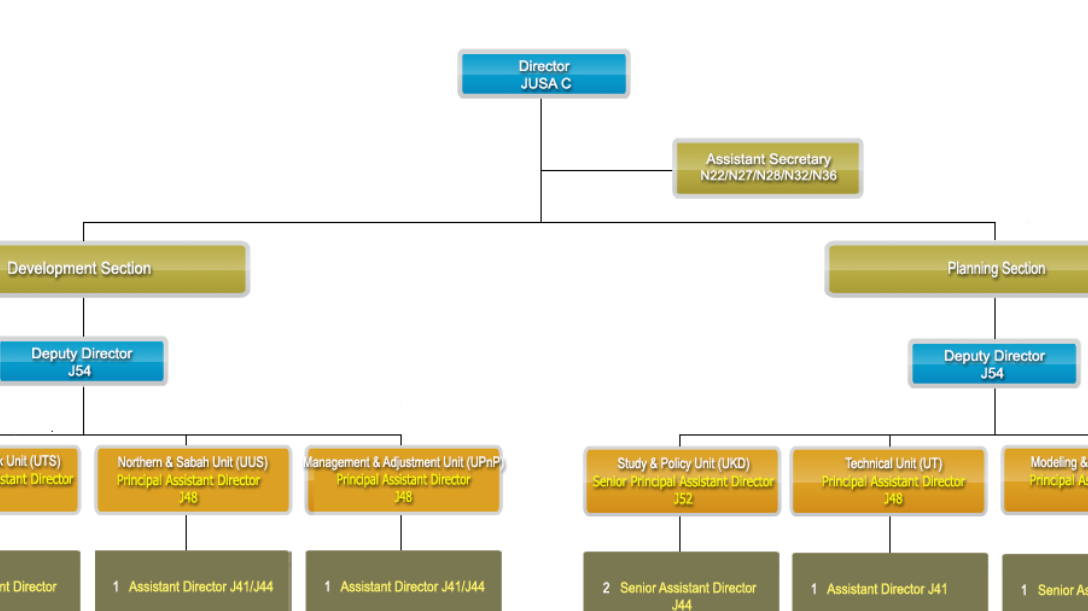
Functions
Detailed Function chart
click here*Content of this Function chart only available in Bahasa Melayu
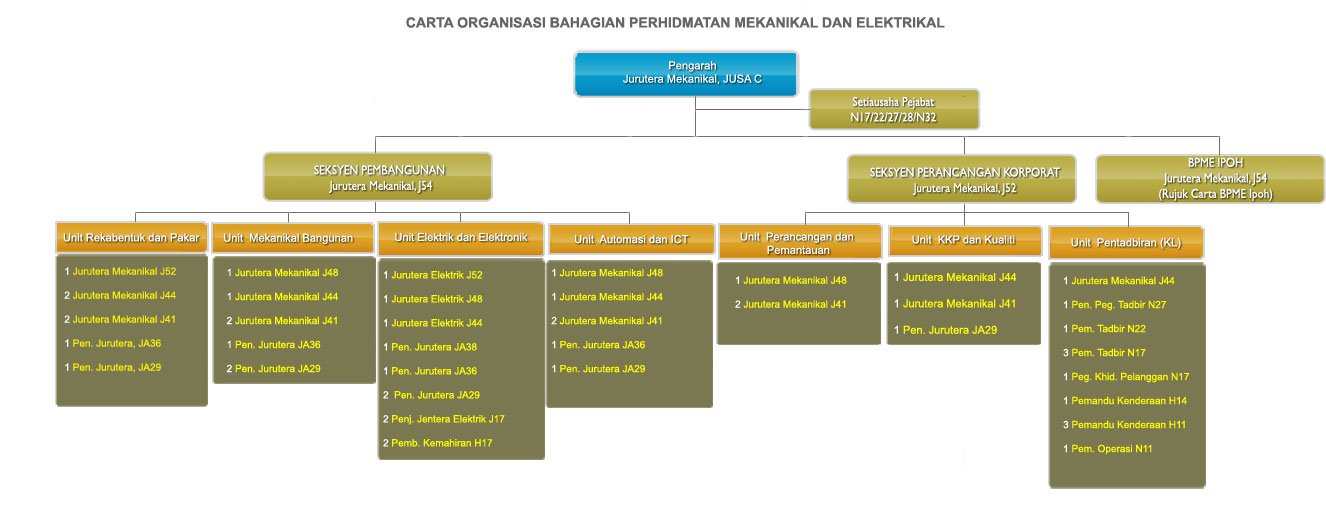
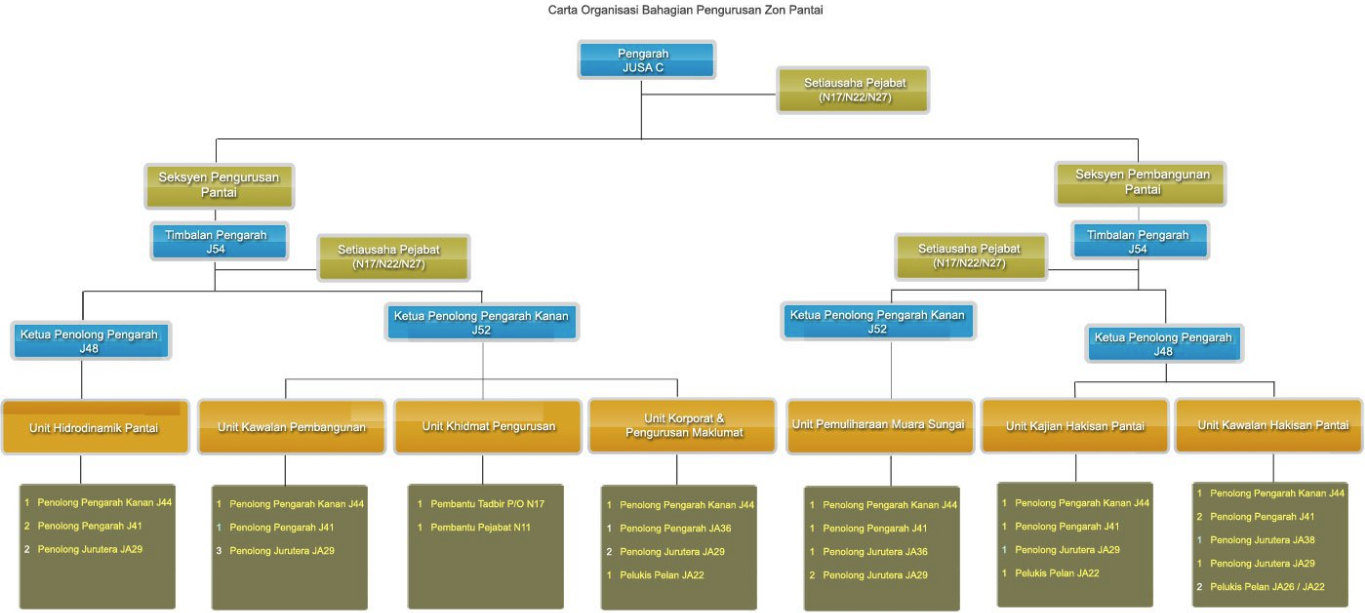
Organisation Chart for Mechanical & Electrical Division (KL)
*Click to enlarge the image
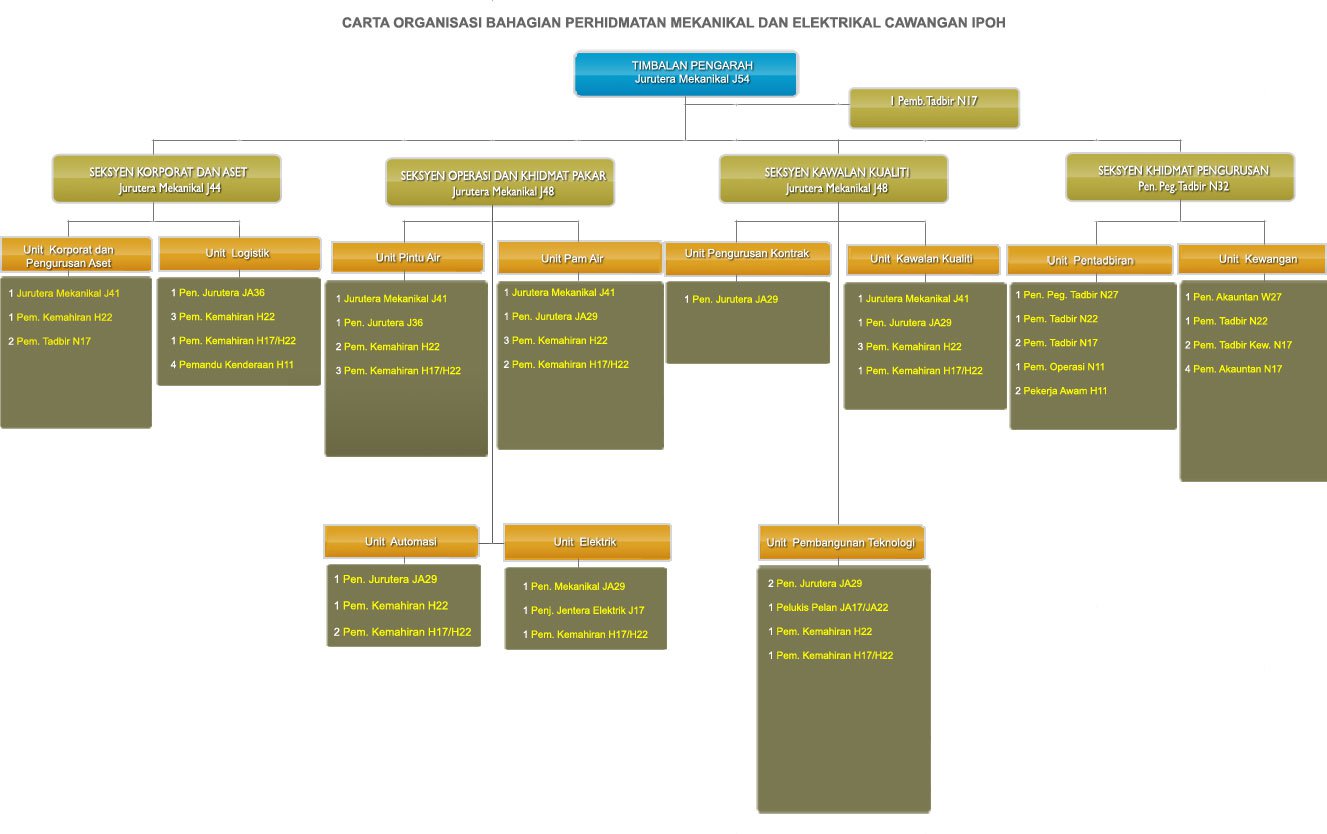
Organisation Chart for Mechanical & Electrical Division (IPOH)
*Click to enlarge the image
Ensure policy implementation effective and clear, complete source of information reference, accurate and efficient, development programme monitoring of and evaluation achieved on target and high image of the department appearance.
Provide in planning service and department and government implementation of policies, monitoring development programme performance, coordinate the information relating service work, coordinate customers complaint and increase image of the department and quality enhancement and audit performance supply ensure services JPS fulfills need and contentment customer.
*Click to enlarge the image
To ensure and guarantee a smooth, efficient and effective services in office management, financial, staff welfare, management and security.
Human Resources Management Section
Prepare and ensure all the personnel information of Management and Professional Group and Support Group relevant,integrated and realibility. The related matters:
Financial Management Section
Prepare, manage and ensure the following based on rules treasury:
Administration And Maintenance
Manage and ensure:
*Click to enlarge the image
Objective of the Human Capital Development Division is to produce competent Department’s personnel through systematic and effective training
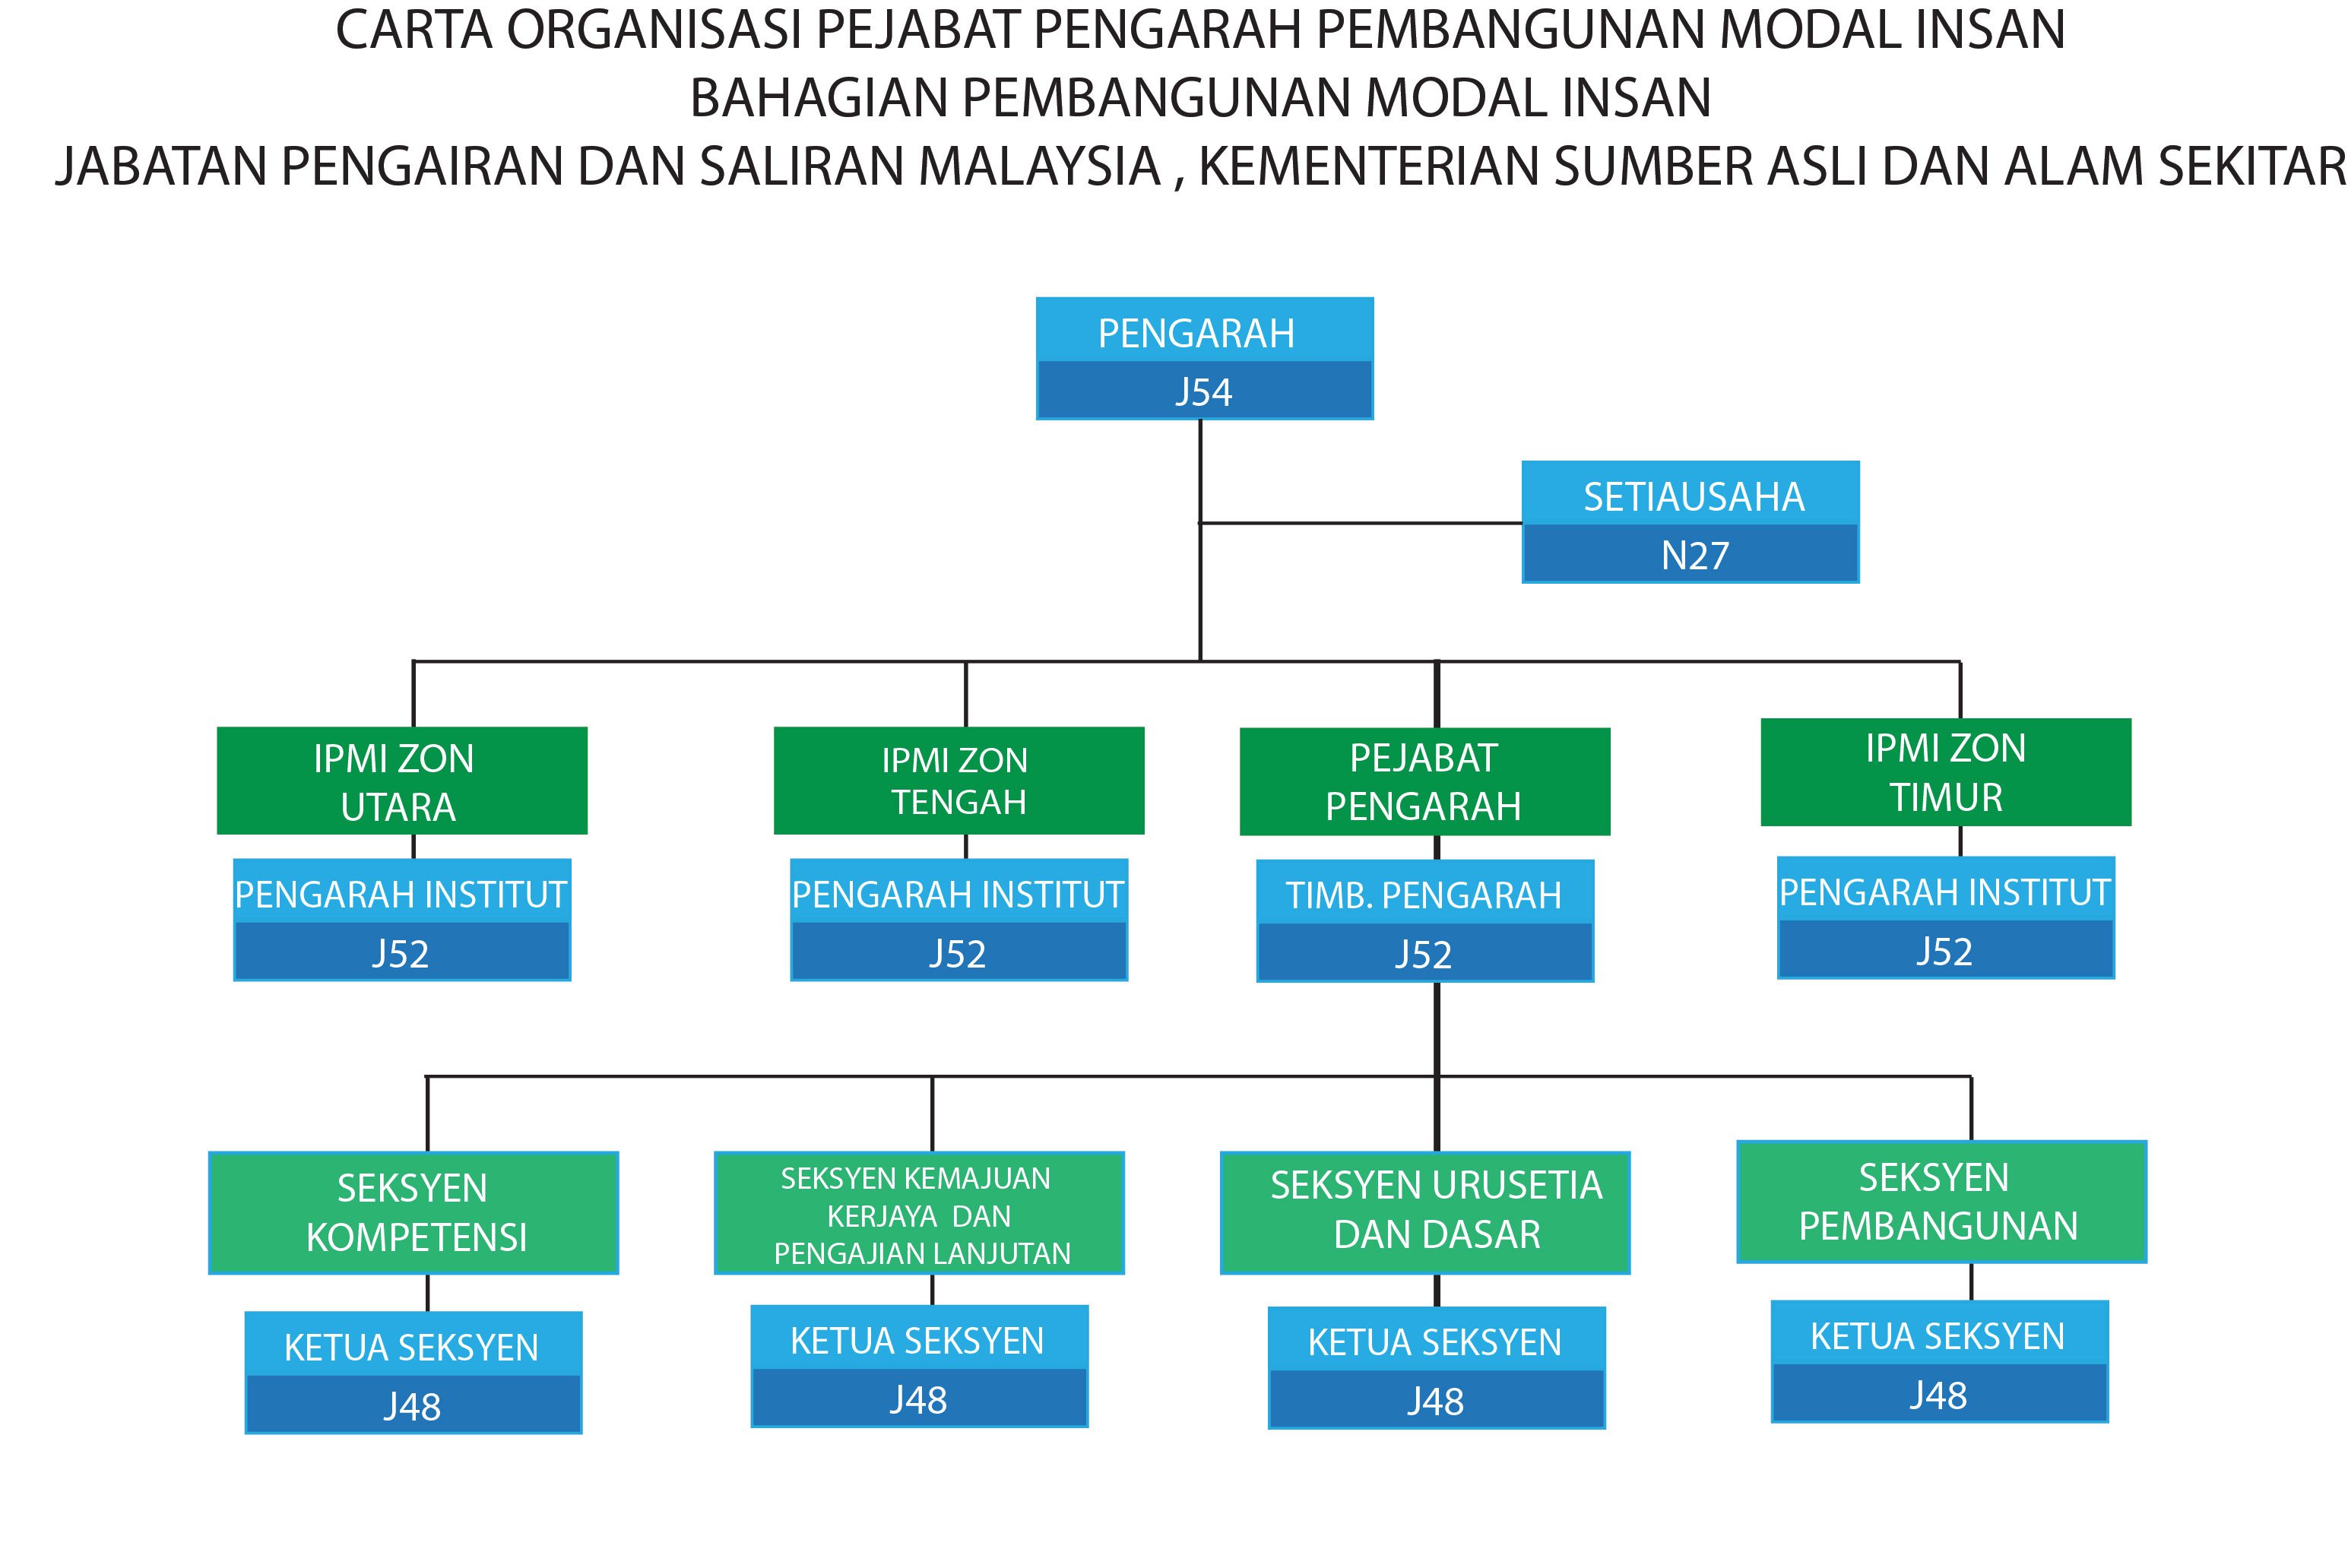
Human Capital Development
*Click to enlarge the image
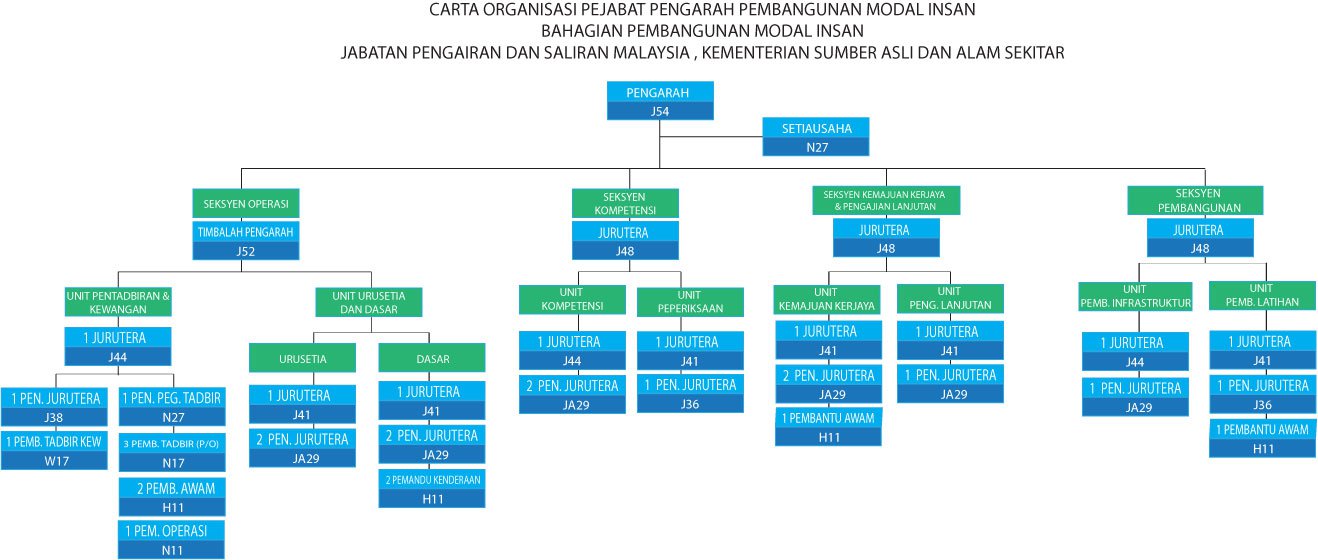
Director Office (PPPMI)
*Click to enlarge the image
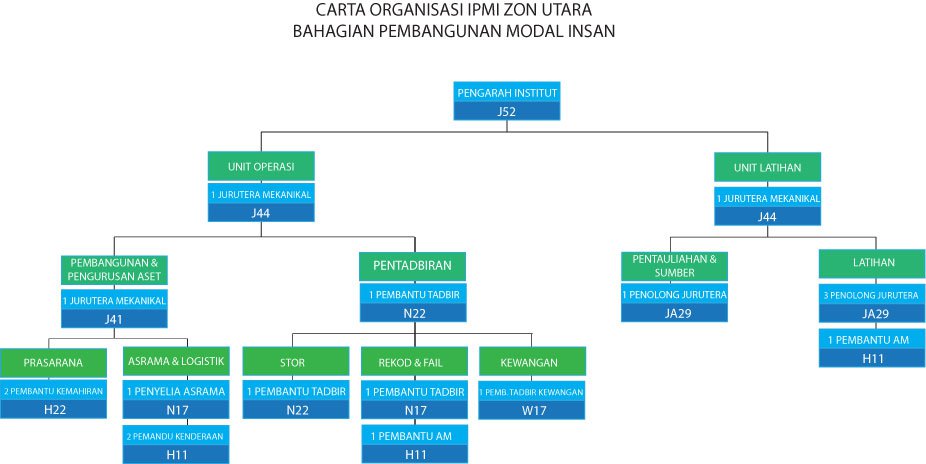
IPMI Northen Region
*Click to enlarge the image
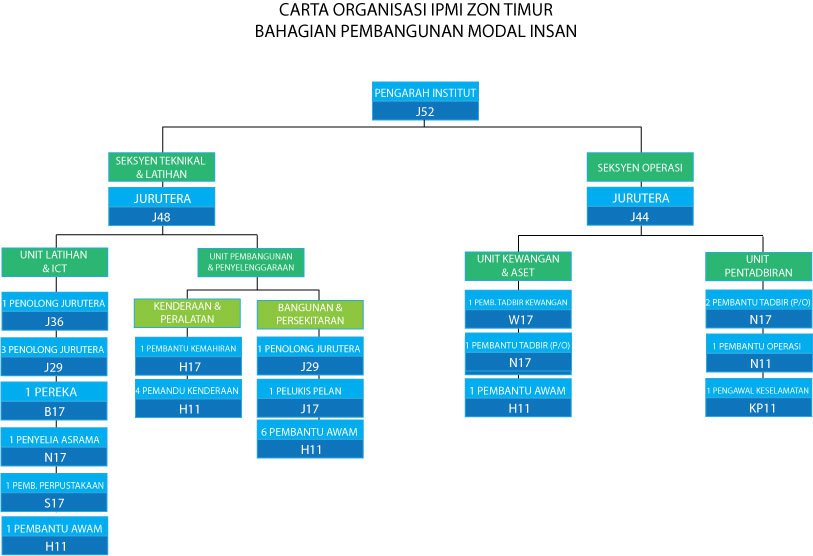
IPMI Eastern Region
*Click to enlarge the image
IPMI Central Region
*Click to enlarge the image


*Click to enlarge the image
Data Unreachable
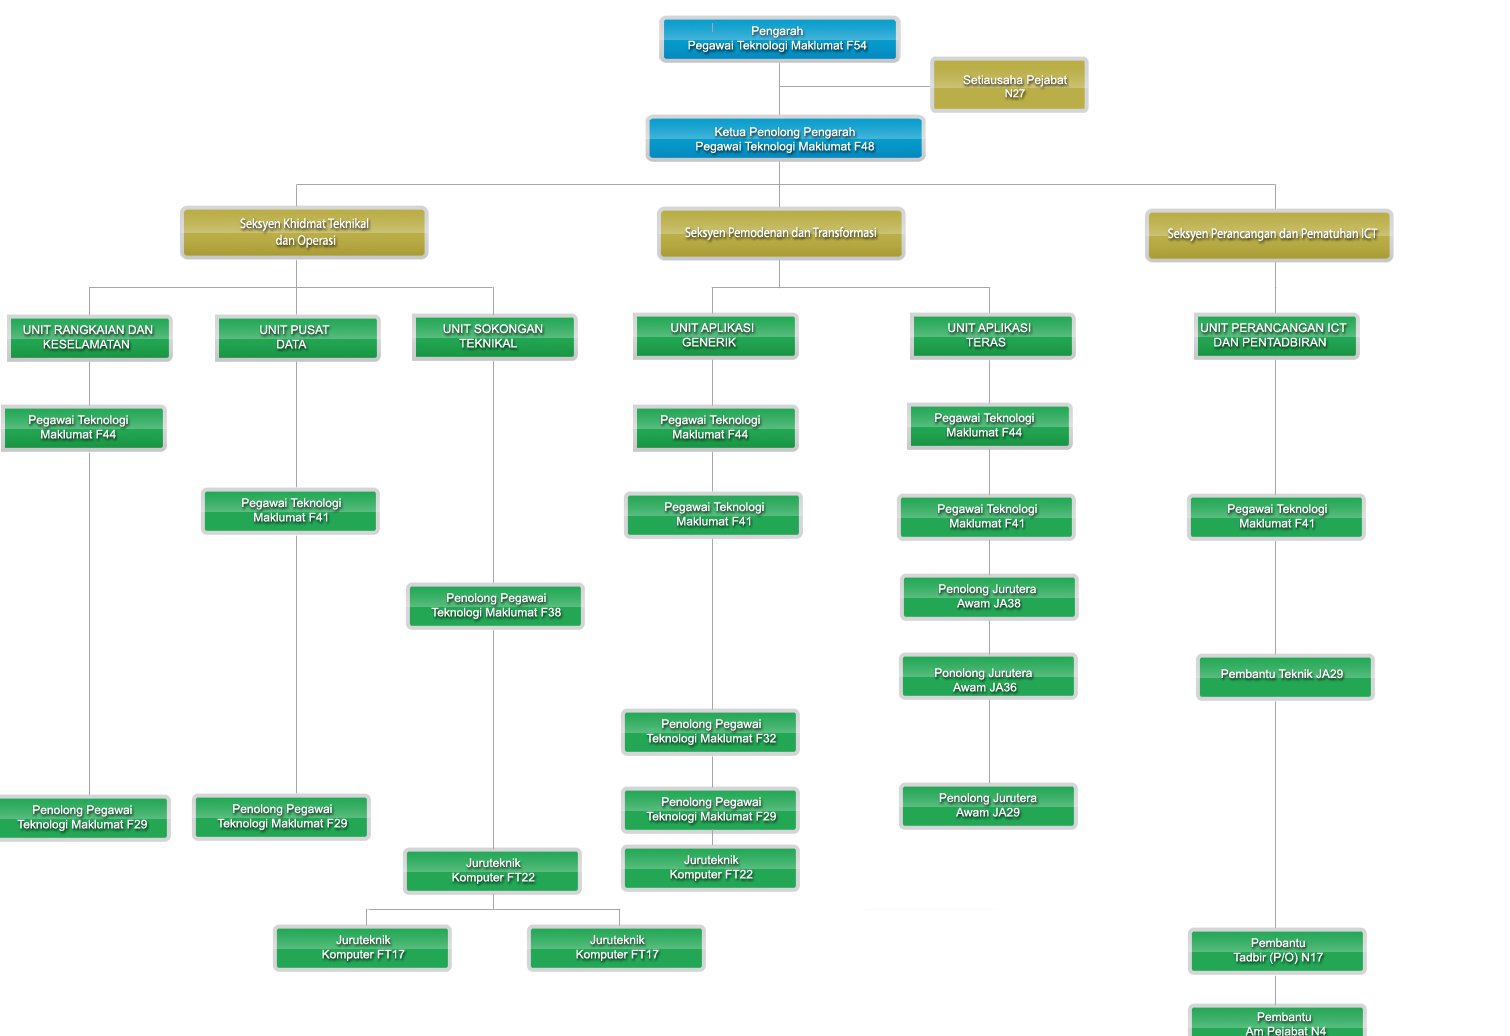
To improve JPS efficiency and effectiveness in administration and information management through the innovative use of information technology.
1. ICT planning in JPS and management of ICT Division
2. Management of ICT operations and technical support
3. Development and maintainance of application systems
Client Charter
*Click to enlarge the image
*Click to enlarge the image
*Click to enlarge the image